


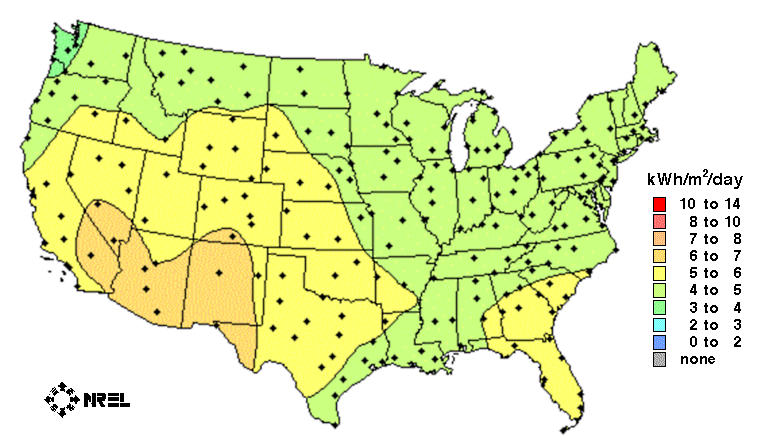
This map shows the general trends in the amount of solar radiation received in the United States and its territories. It is a spatial interpolation of solar radiation values derived from the 1961-90 National Solar Radiation Data Base (NSRDB). The dots on the map represtent the 239 sites of the NSRDB.
Maps of the average values are porduced by averaging all 30 years of data for each site. Maps of maximum and minimum values are composites of specific months and years for which each site achieved its maximum or minimum amounts of solar radiation.
Though useful for identifying general trends, this map should be used with caution for site-specific resource evaluations because variations in solar radiation not reflected in the maps can exist, introducing uncertainty into resource estimates.
Average Daily Sunlight for Selected Cities
| State | City | Average |
| Alabama | Montgomery | 4.23 |
| Alaska | Fairbanks | 3.99 |
| Arizona | Phoenix | 6.58 |
| Arkansas | Little Rock | 4.69 |
| California | Los Angeles | 5.62 |
| Colorado | Grand Junction | 5.85 |
| DC | Washington | 4.23 |
| Florida | Miami | 5.62 |
| Georgia | Atlanta | 4.74 |
| Hawaii | Honolulu | 6.02 |
| Idaho | Boise | 4.92 |
| Illinois | Chicago | 3.14 |
| Indiana | Indianapolis | 4.21 |
| Iowa | Ames | 4.4 |
| Kansas | Manhattan | 4.57 |
| Kentucky | Lexington | 4.94 |
| Louisiana | New Orleans | 4.92 |
| Maine | Portland | 4.51 |
| Maryland | Silver Hill | 4.47 |
| Massachusetts | Boston | 3.84 |
| Michigan | E. Lansing | 4 |
| Minnesota | St. Cloud | 4.53 |
| Mississippi | Meridian | 4.43 |
| Missouri | Columbia | 4.73 |
| Montana | Great Falls | 4.93 |
| Nebraska | Omaha | 4.9 |
| Nevada | Las Vegas | 6.41 |
| New Jersey | Sea Brook | 4.21 |
| New Mexico | Albuquerque | 6.77 |
| New York | New York City | 4.08 |
| North Carolina | Greensboro | 4.71 |
| North Dakota | Bismark | 5.01 |
| Ohio | Columbus | 4.15 |
| Oklahoma | Oklahoma City | 5.59 |
| Oregon | Medford | 4.51 |
| Pennsylvania | State College | 3.91 |
| Rhode Island | Newport | 4.23 |
| South Carolina | Charleston | 5.06 |
| South Dakota | Rapid City | 5.23 |
| Tennessee | Nashville | 4.45 |
| Texas | El Paso | 6.72 |
| Utah | Salt Lake City | 5.26 |
| Virginia | Richmond | 4.13 |
| Washington | Spokane | 4.48 |
| West Virginia | Charleston | 3.65 |
| Wisconsin | Madison | 4.29 |
| Wyoming | Lander | 6.06 |
- home
- |
- product tour
- |
- financial info
- |
- faqs
- |
- about us
- |
- contact us
- |
- privacy
- |
- order